You no longer have to guess how your community is performing. The new community analytics dashboard gives admins and owners one place to track revenue, membership, traffic, and engagement, with flexible date filters and data export options.
What’s new
Community analytics dashboard
EveryCatch now includes a dedicated analytics area under Settings → Analytics. You get a single, focused view of your community’s performance so you can quickly understand what is working and where to adjust.
Key performance metrics
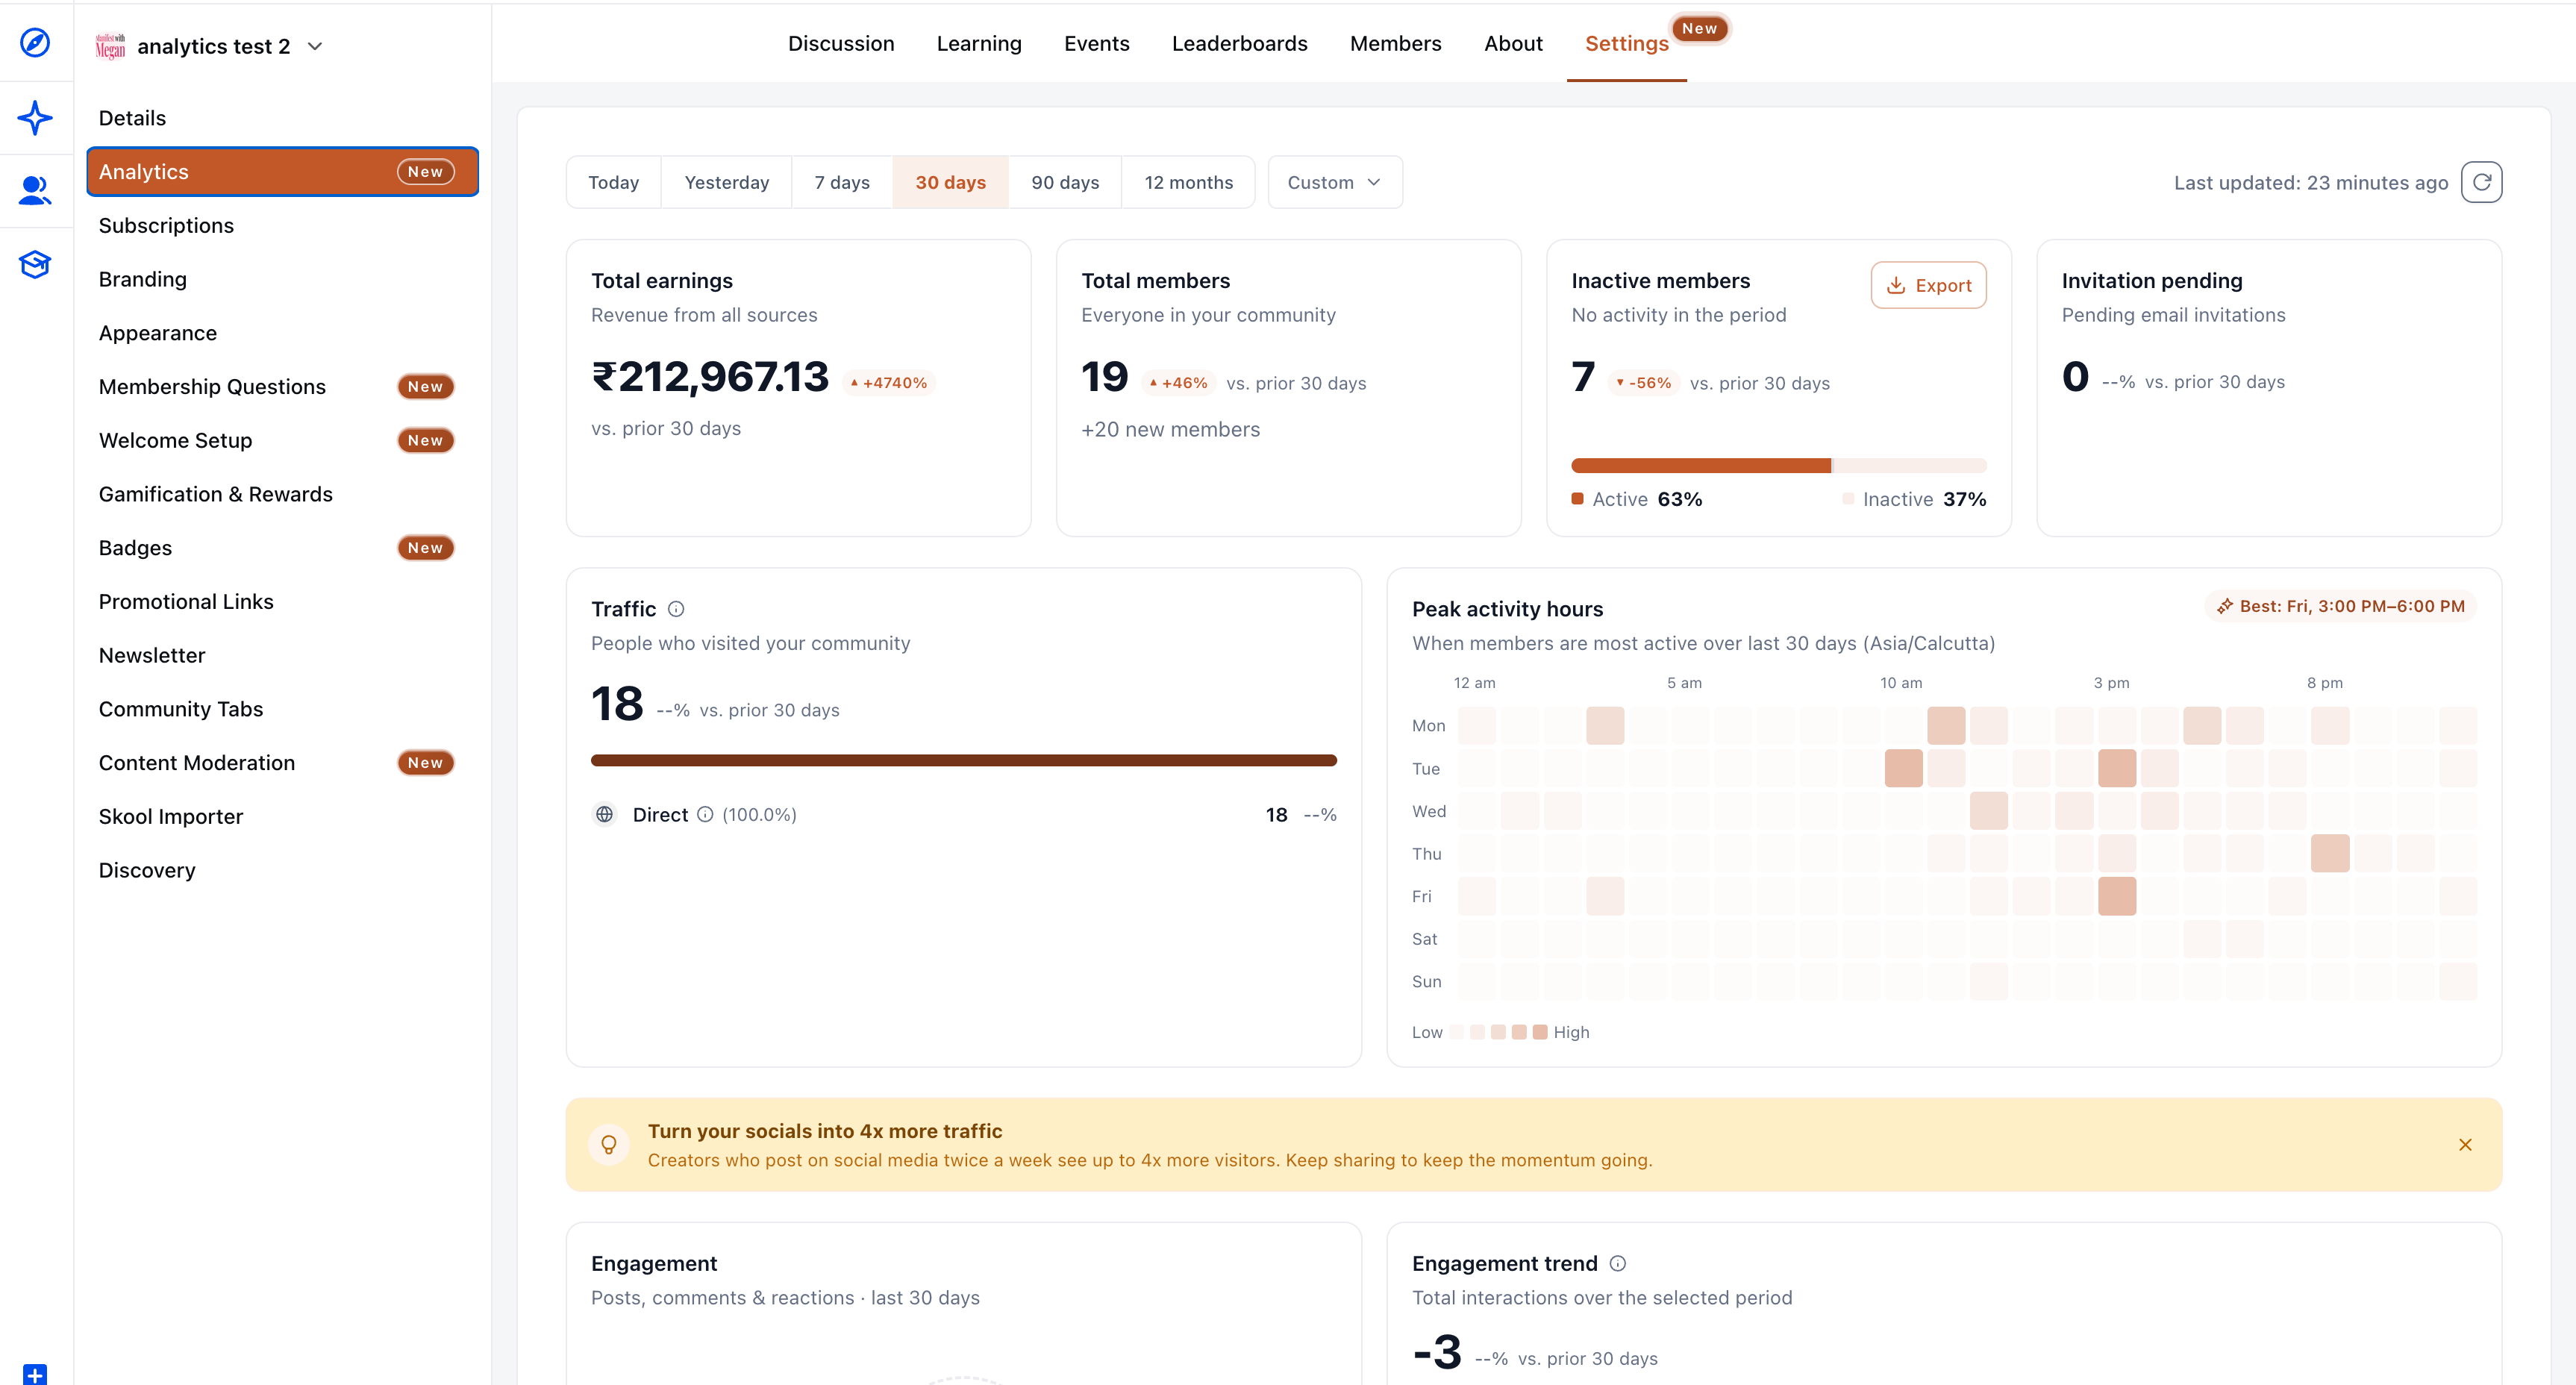
At the top of the dashboard, four headline cards give you an instant snapshot of community health:
- Total earnings – Net transaction revenue attributed to your community (purchases minus refunds and chargebacks), shown in your account’s currency.
- Total members – Your current active member count, with new members who joined during the selected period shown separately.
- Inactive members – Active members who have no tracked activity in the selected period. You also see a percentage bar showing the split between active and inactive members. An Export button lets you download inactive members as a CSV file so you can follow up with them.
- Invitation pending – Email invites that are still outstanding and have not been cleared by the end of the selected date range.
Each card includes a percentage change comparison against the previous period of the same length, shown with ▲ or ▼ indicators. If the previous period has a value of 0, the interface shows N/A for that comparison.
Flexible date filters
You can filter the entire dashboard by date range using quick presets or a custom range. Choose from Today, Yesterday, 7 days, 30 days, 90 days, 12 months, or Custom. The default view is the last 30 days. When you change the date range, all cards and charts on the page update to match your selection.
Traffic sources
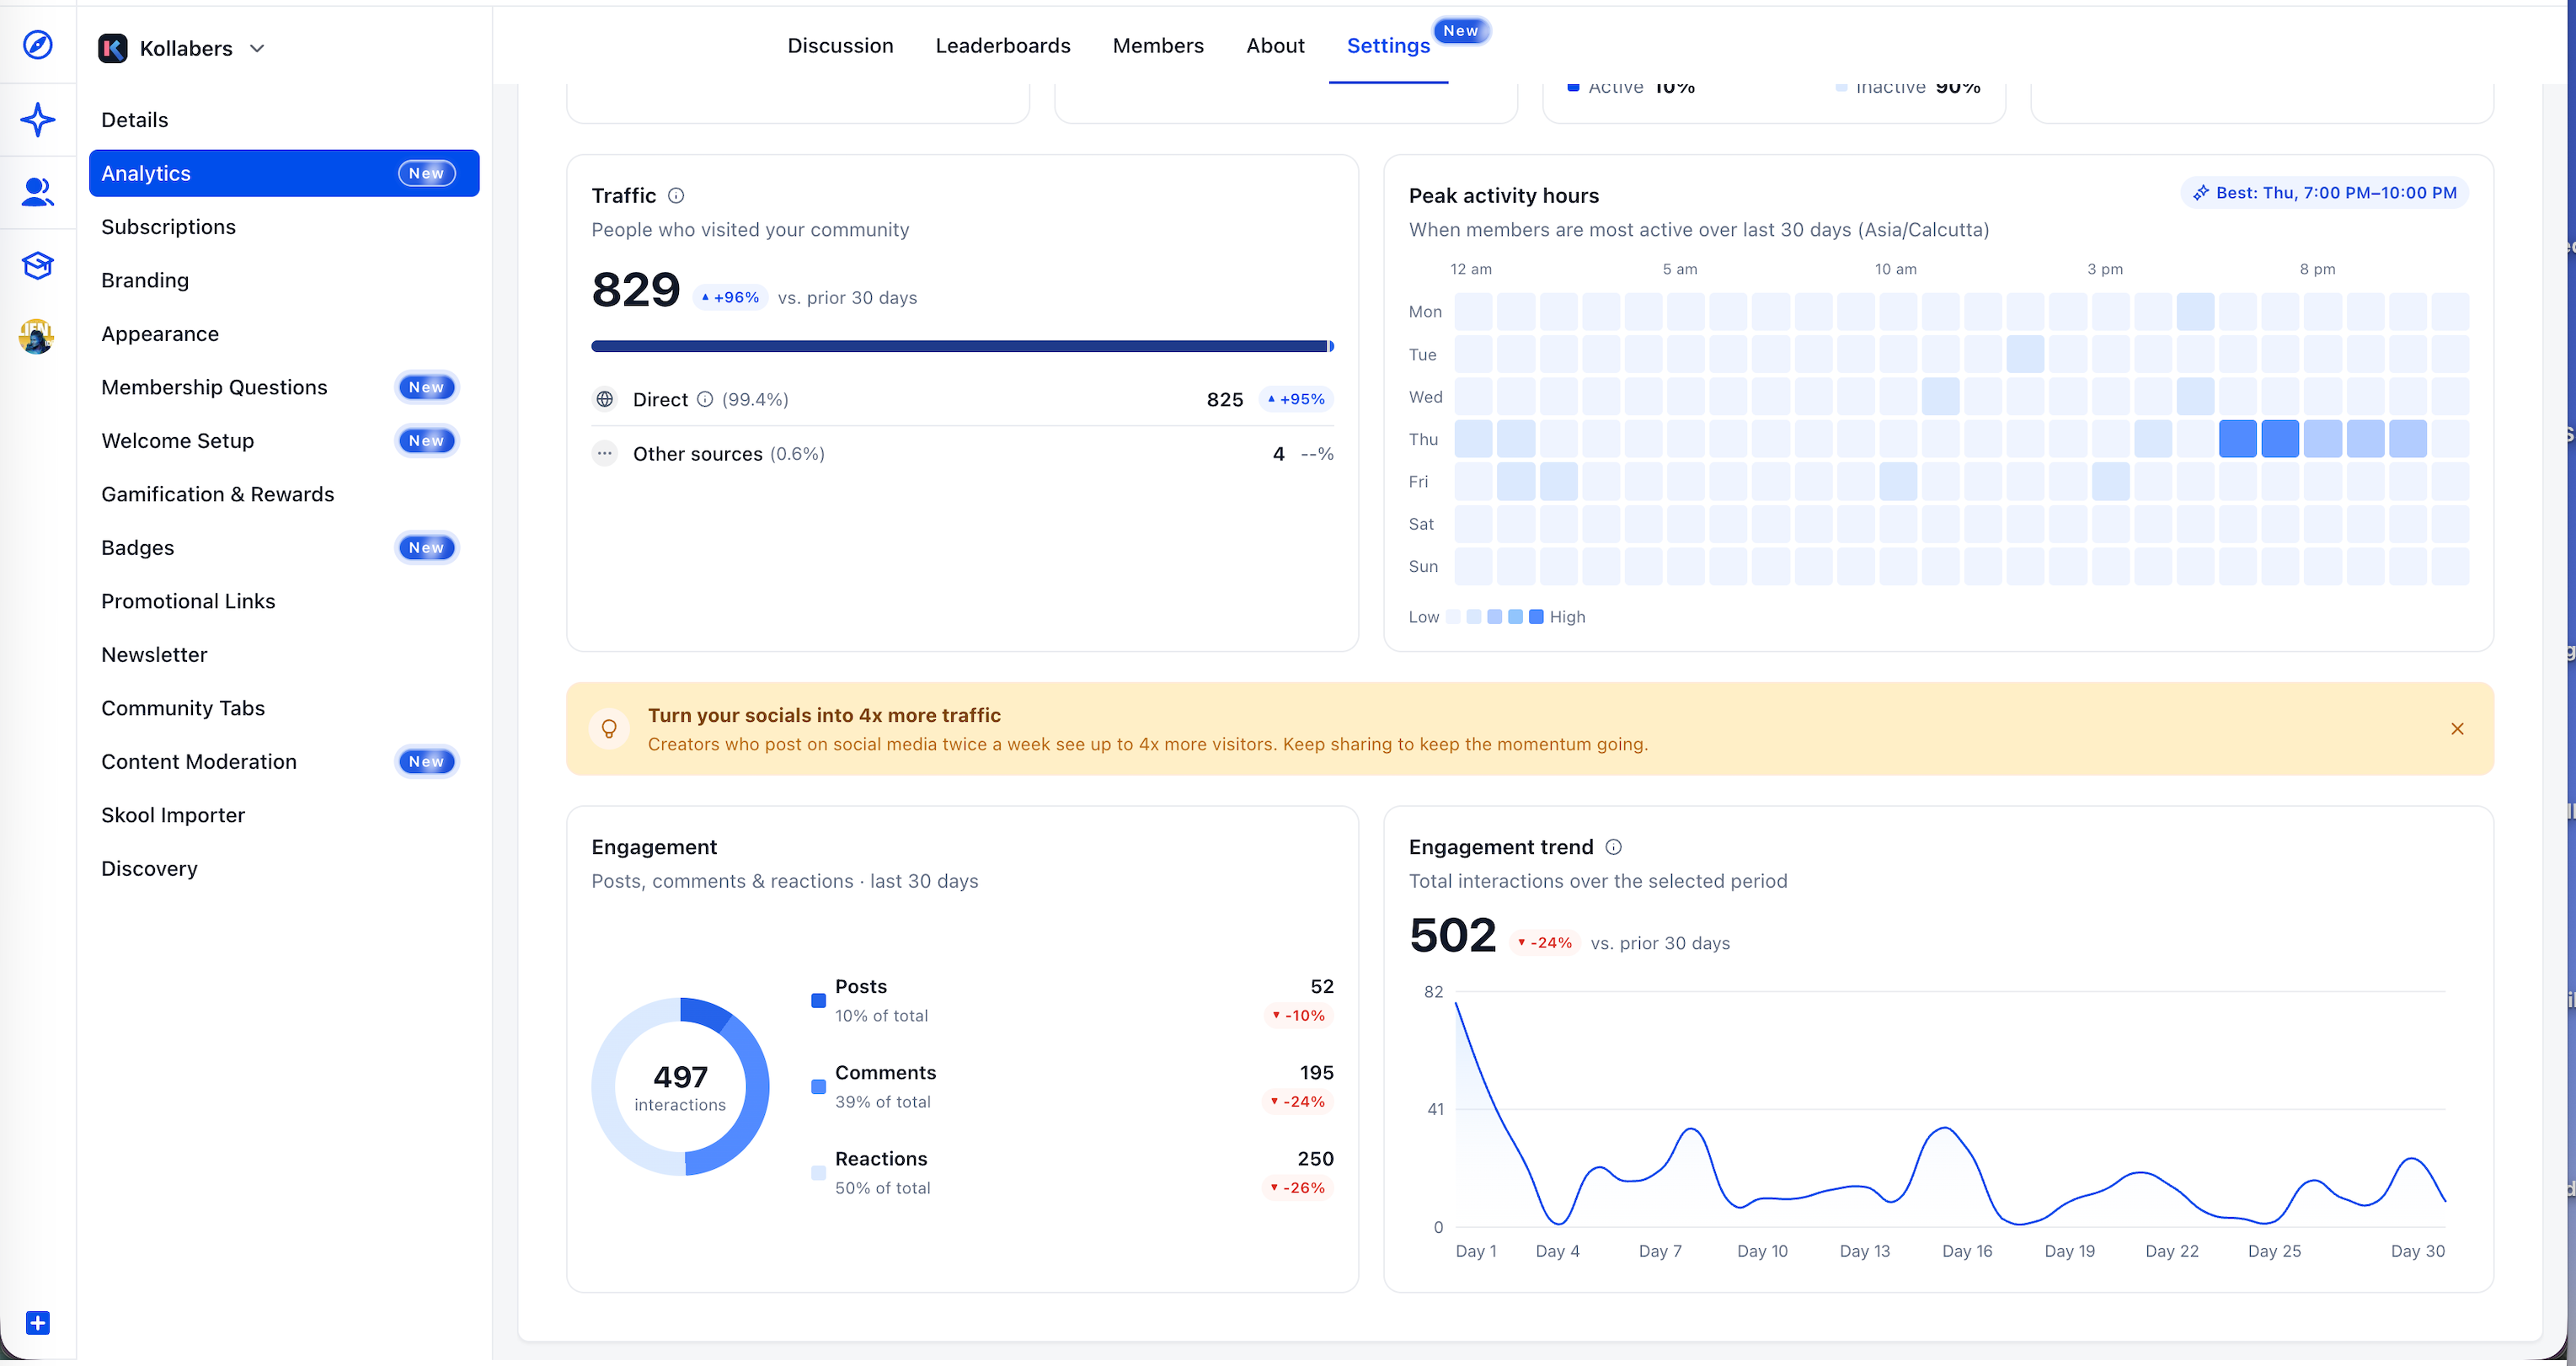
You can now see how members are discovering and accessing your community. Traffic is broken down by source, including Direct, Instagram, YouTube, Facebook, LinkedIn, and Other. Up to four named sources are shown individually by volume, and any remaining sources are grouped into Other. Each row includes its own change indicator for the selected period so you can see which channels are growing or slowing.
Peak activity hours
A day-by-hour heatmap shows you when members are most active, using the community’s timezone. Darker blocks represent higher activity, and the busiest time window is clearly highlighted (for example, “Best: Thu, 7:00 PM - 10:00 PM”). You can use this to schedule posts, events, and live sessions at the times when your audience is most likely to engage.
Engagement
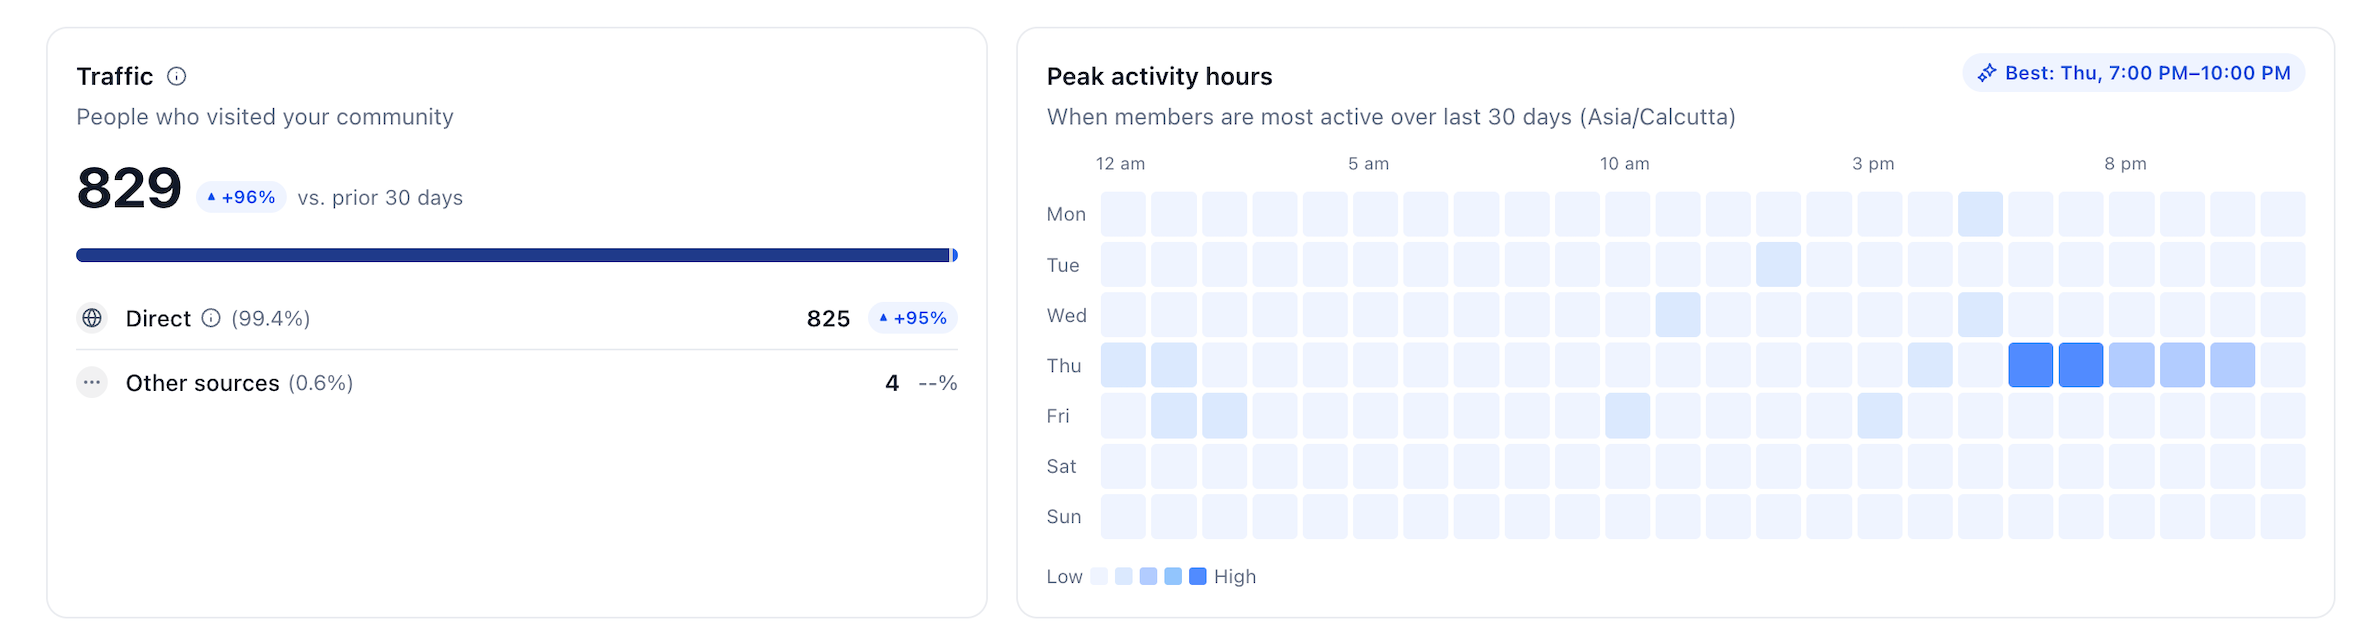
The engagement section helps you understand how members are interacting in your community. A donut chart breaks down total interactions into Posts, Comments, and Reactions, with both counts and share of total. Engagement numbers also include poll votes and event RSVPs so you have a complete view of participation.
Next to the donut chart, an engagement trend line chart shows total interactions over the selected date range, along with a percentage change compared to the previous equal-length period. This helps you quickly see whether engagement is increasing, steady, or declining over time.
How to access
- Go to Settings in your community.
- Click Analytics in the left sidebar.
- Choose a date range using the filter bar at the top of the page.
- Review your headline metrics, traffic sources, peak activity hours, and engagement in one view.
- If you want to reach out to quiet members, use the Export button on the Inactive members card to download a CSV list you can use for campaigns or personal follow-ups.
Why this matters
Previously, understanding how your community was doing often meant pulling information from several tools and trying to combine it yourself. There was no single place where you could easily compare revenue, membership trends, traffic sources, and engagement together.
The community analytics dashboard brings this into one reliable view. It helps admins and owners spot disengagement sooner, see which traffic sources contribute most to growth, plan content and events around actual peak hours, and quickly export inactive member lists for targeted follow-up.
Notes
- Traffic page-view tracking is active and rolling out. Counts will begin to populate as new visits are recorded from now on; historical traffic is not backfilled.
- Unique visitors are counted by user ID, with a fallback to a hashed IP fingerprint when needed. Known bots and crawlers are excluded from these counts.
- Time buckets in the heatmap and charts use the community’s timezone set in the interface.
- The dashboard uses your account’s local currency when displaying earnings figures.
- Planned update: a community analytics V2 release is in the works. Based on feedback from this first version, it will provide a deeper analytics experience with richer insights and additional capabilities.