Rebuilt course progress analytics
Overview
Rebuilt course progress analytics is now available in EveryCatch, giving you a faster and more reliable way to see how learners move through your courses. You can track completion trends, see where people drop off, and drill into individual learner progress, all in a single, focused dashboard.
What changed
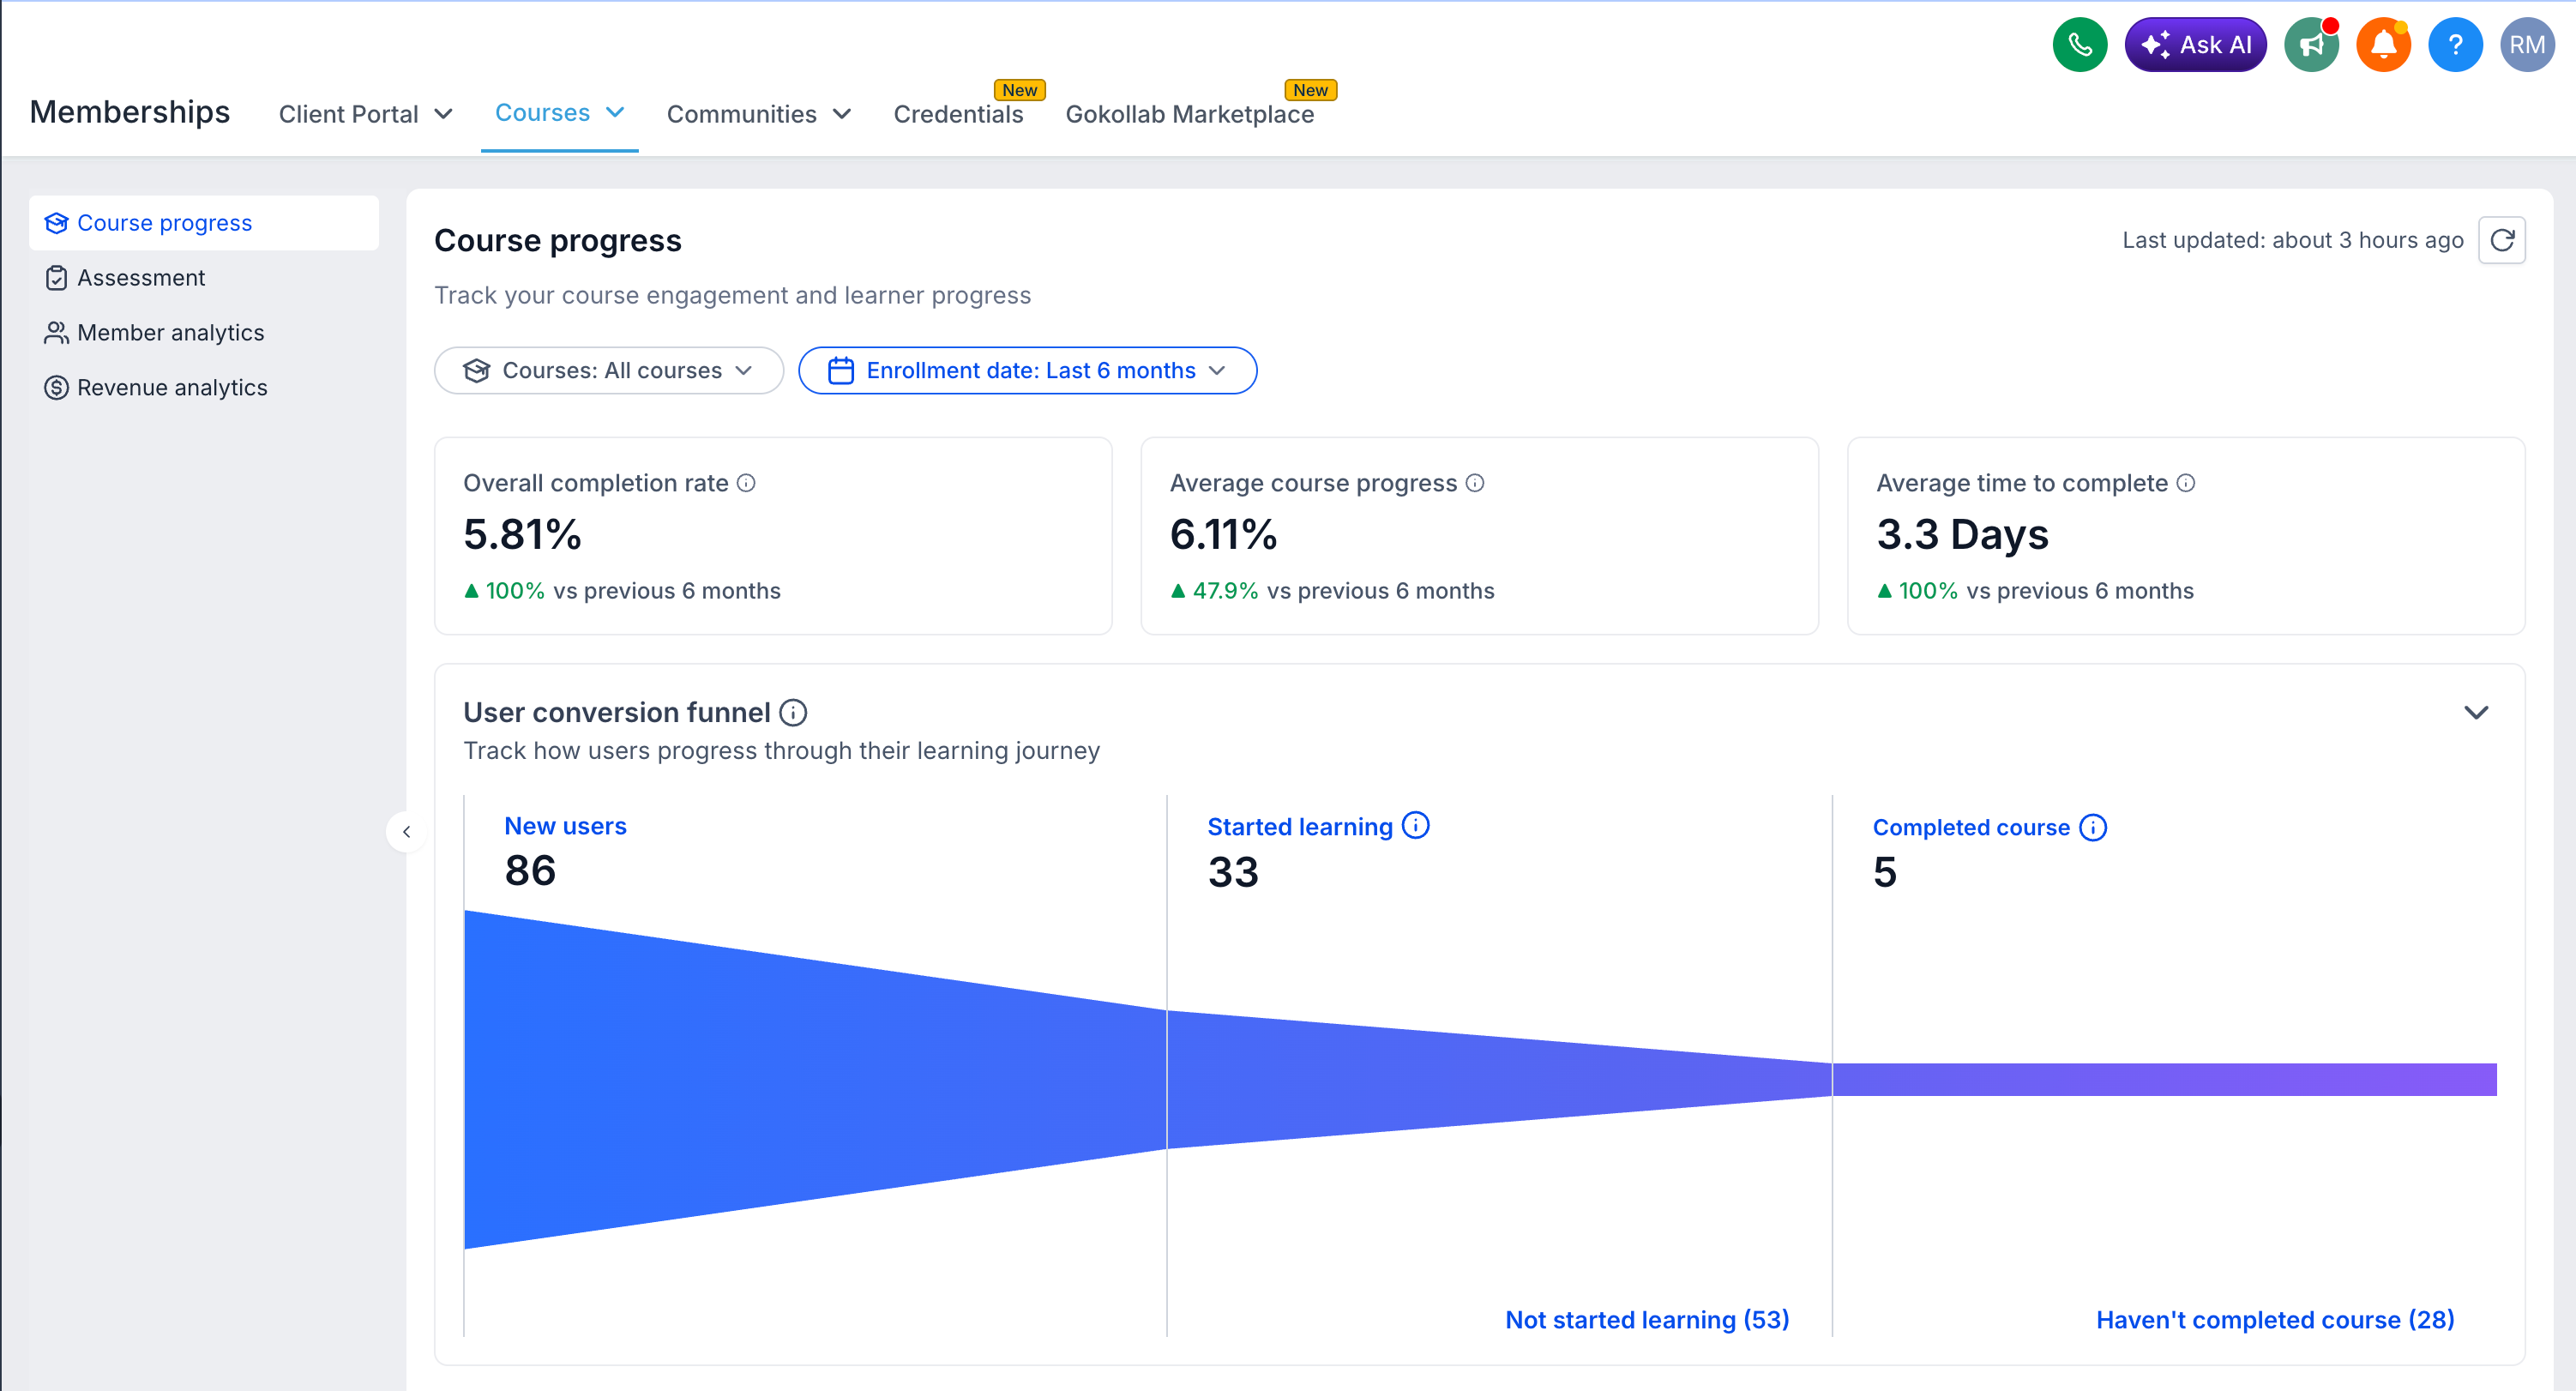
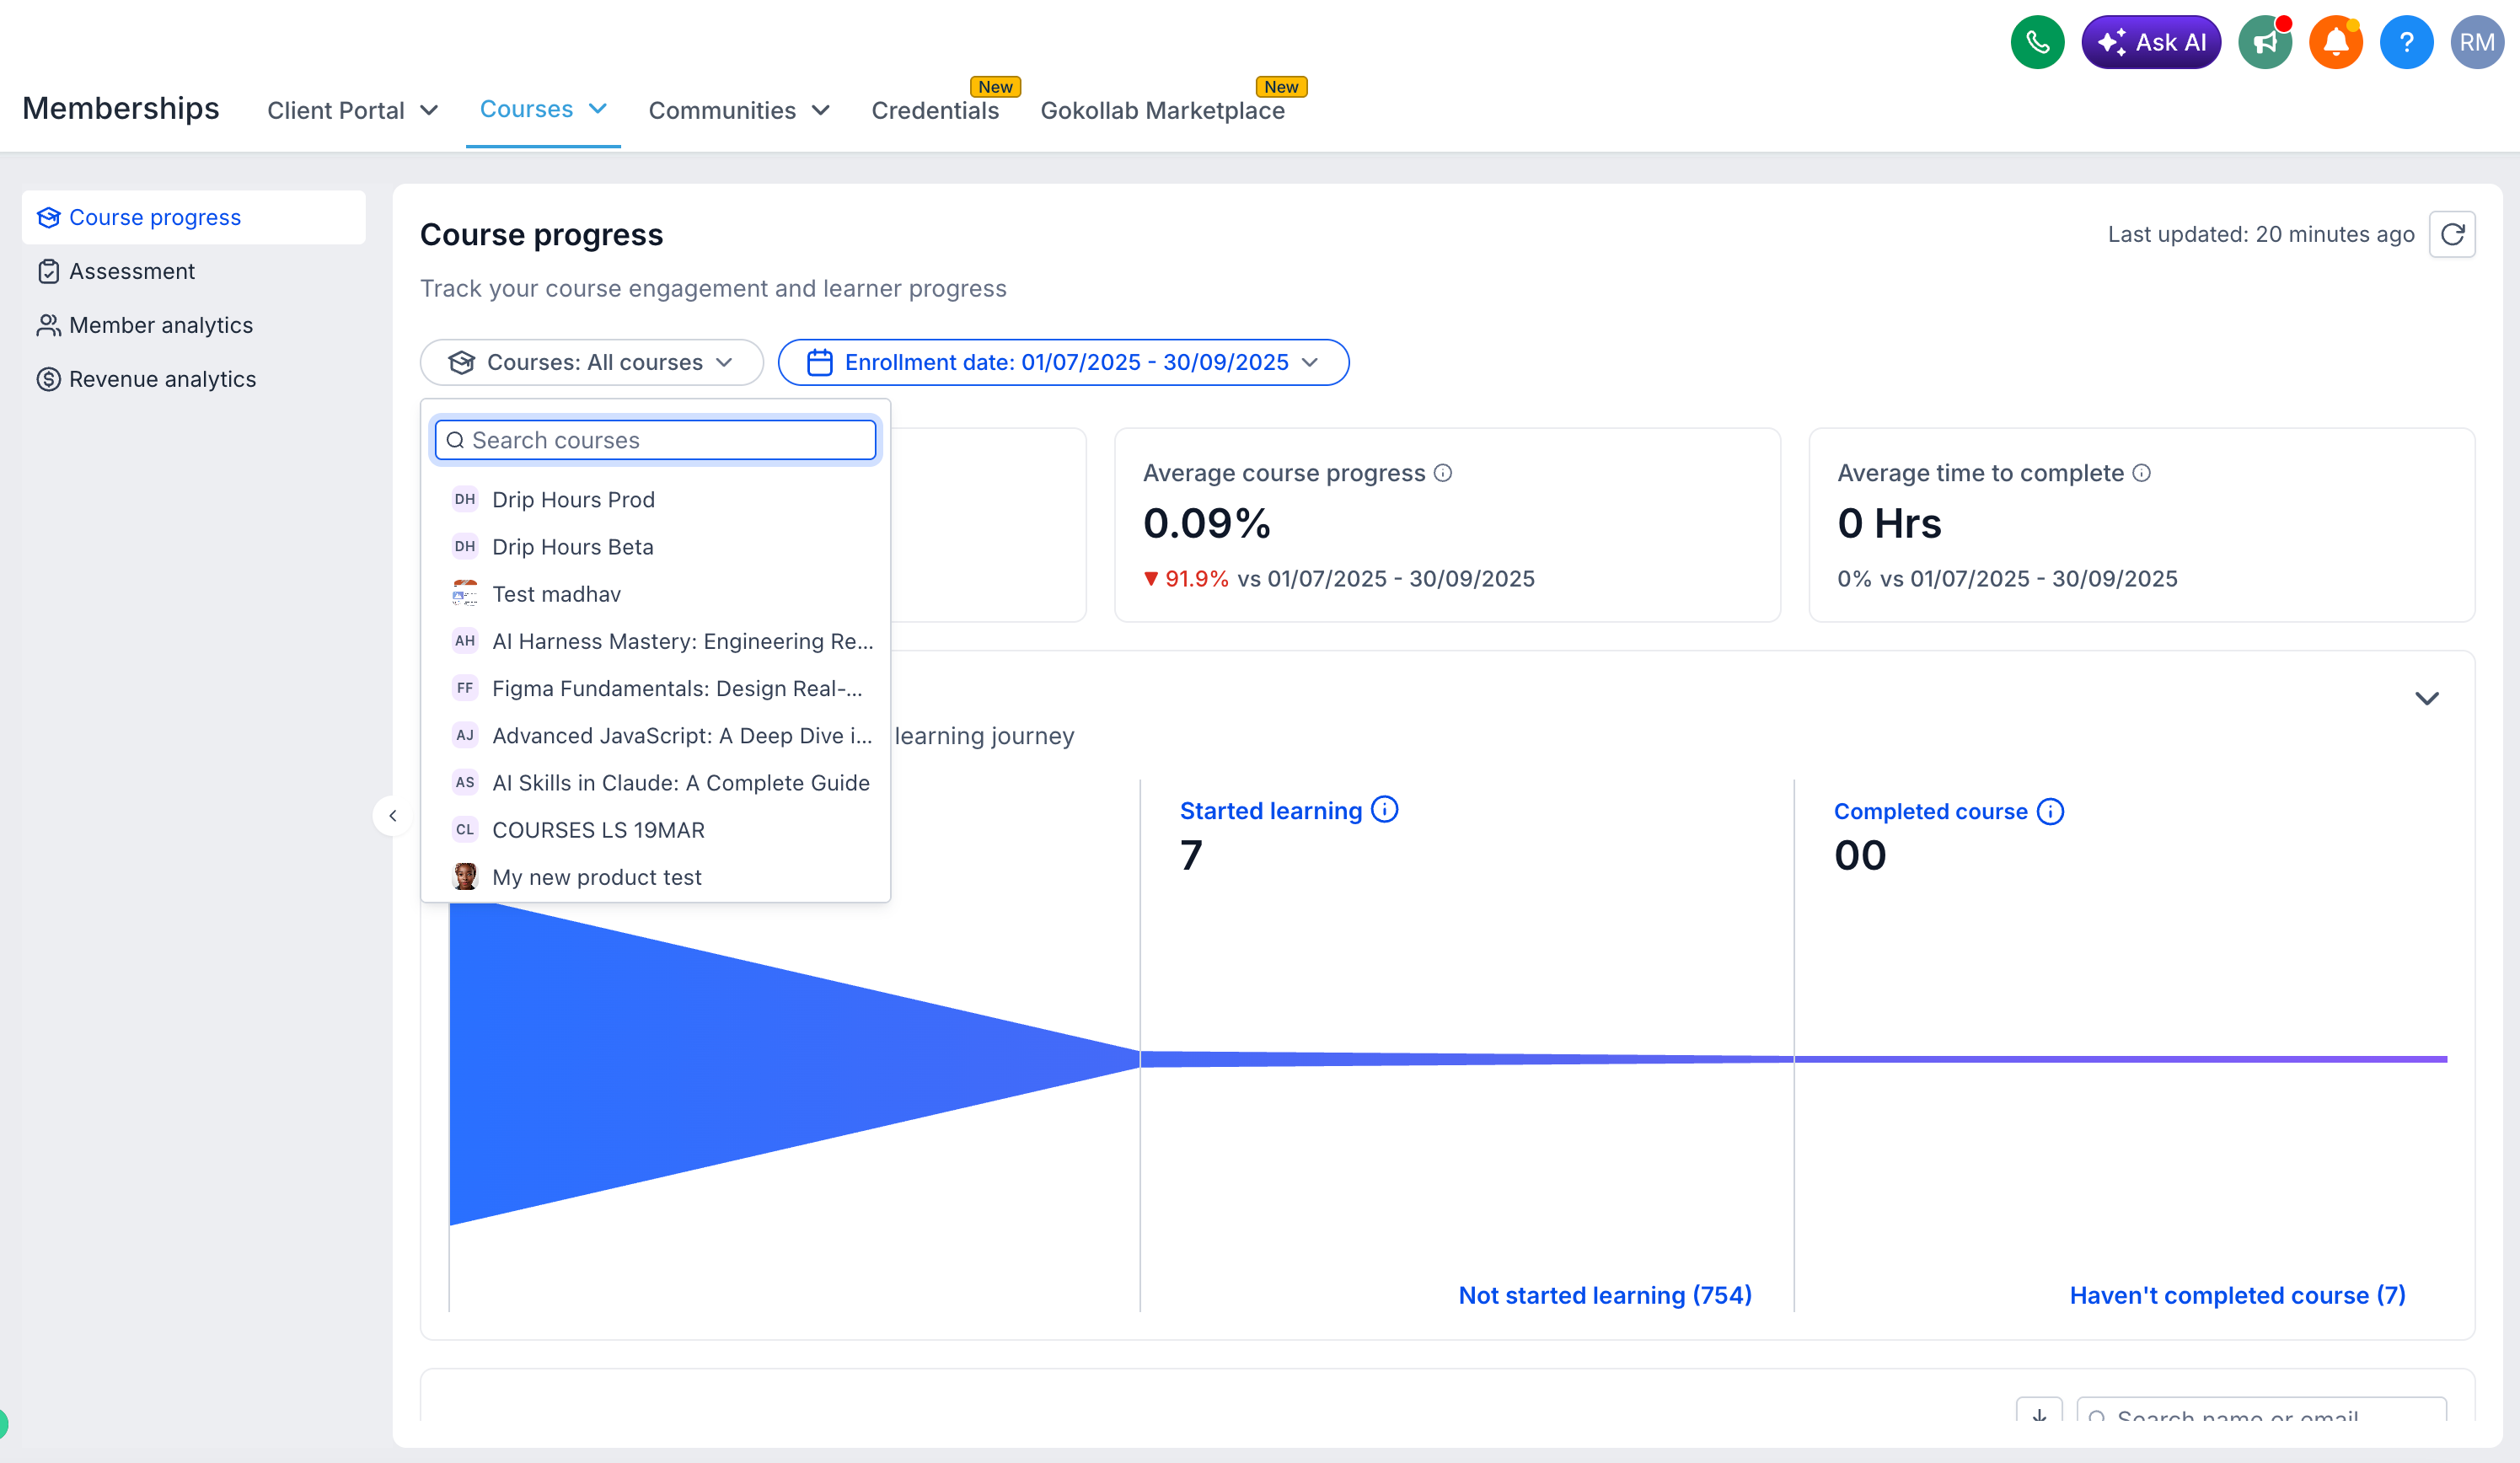
You now get a unified course progress dashboard with filters for course and enrollment date, so you can quickly narrow reports to the exact learners and timeframes you want to review.
EveryCatch now shows key learning metrics, including completion rate, average progress, and time to complete, along with period-over-period comparisons so you can see how these numbers change over time.
A clear enrollment funnel now shows how many people are Enrolled → Started → Completed, helping you understand where learners fall off in the course experience.
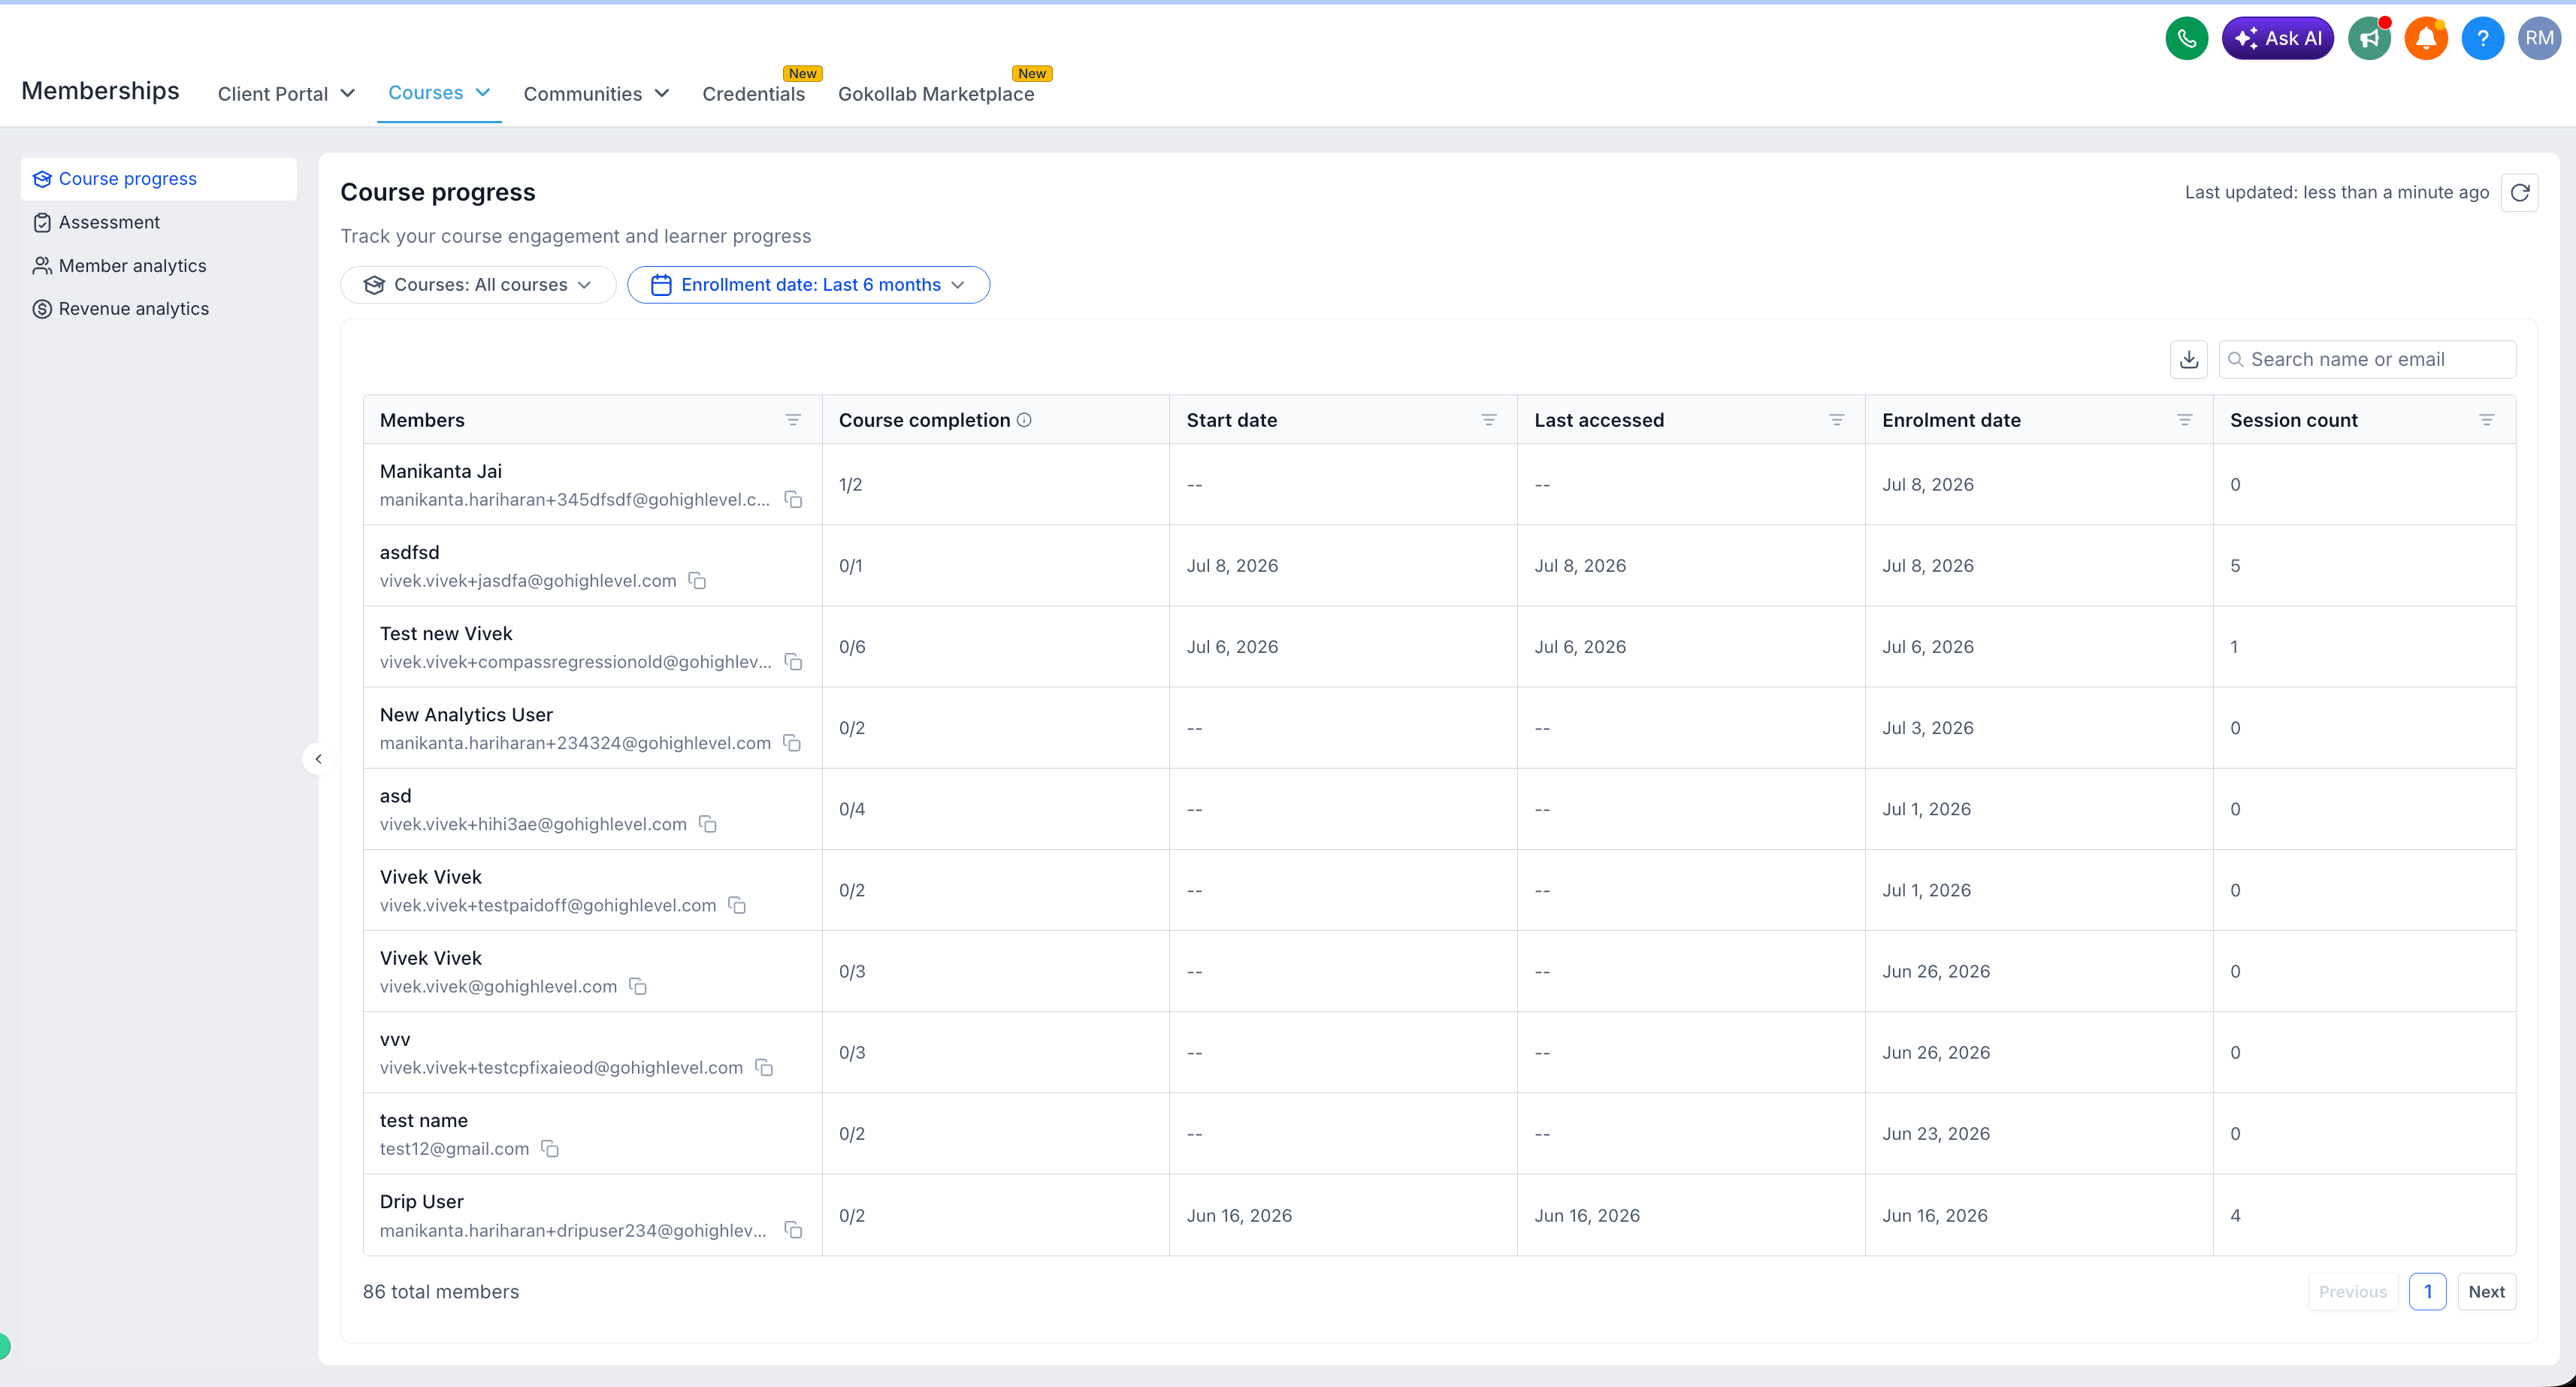
You can now use an expanded member progress table that lists enrollment details, activity history, completion status, and session-level information for each learner, so you can follow up on specific cases when needed.
EveryCatch now lets you export any filtered view as a CSV file, with large exports automatically delivered by email so you can work with the data in your own tools or share it with others.
Faster performance
Course progress analytics pages now load up to 43% faster, so you can move between filters and reports with less waiting.
The new experience downloads up to 90% less data, which helps dashboards feel quick and responsive, especially on slower connections.
Overall, you get a smoother and more responsive analytics workflow while reviewing course performance and learner activity.
Why it matters
You can measure learner engagement from one place, with a single view that connects high-level trends to individual learner details.
You can quickly spot learners who need attention before they disengage, using the funnel and member progress table to see who is stuck or falling behind.
You can make data-driven improvements to your courses by comparing periods, tracking completion and time-to-complete, and testing changes over time.
You can export insights to share with your team or other stakeholders, or to combine with data from other systems in your own reporting.
Availability
To start using the new course progress analytics, enable "New Course Progress Analytics" in Labs. Once it is enabled, you can access it from your account navigation.
Memberships → courses → analytics → course progress
Coming next
Assessment analytics and revenue analytics are coming soon to round out the full courses analytics experience in EveryCatch, so you can see learning outcomes and financial performance alongside course progress.
Need help with this?
If you'd like help setting this up or want to know what it means for your account, book a quick call and we'll walk you through it.
